For work, I like to use the python library Pandas to crunch numbers for the libraries. Pandas is a library that is able to read CSVs and Excel files and has a bunch or really convenient ways to sort, filter, reshape, and otherwise play with data.
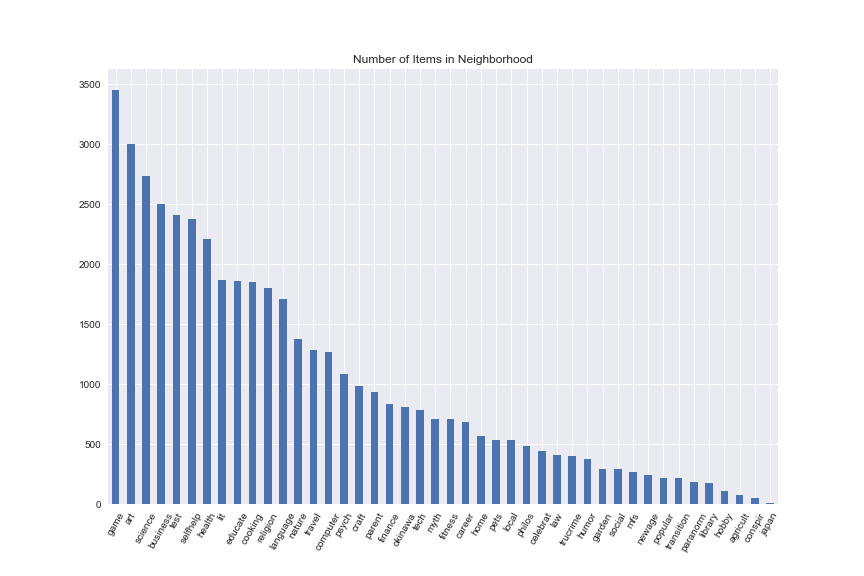
Our items are shelved in neighborhoods, which are kind of like sections in a bookstore. Here are some of the neighborhoods and the number of items we have in each.
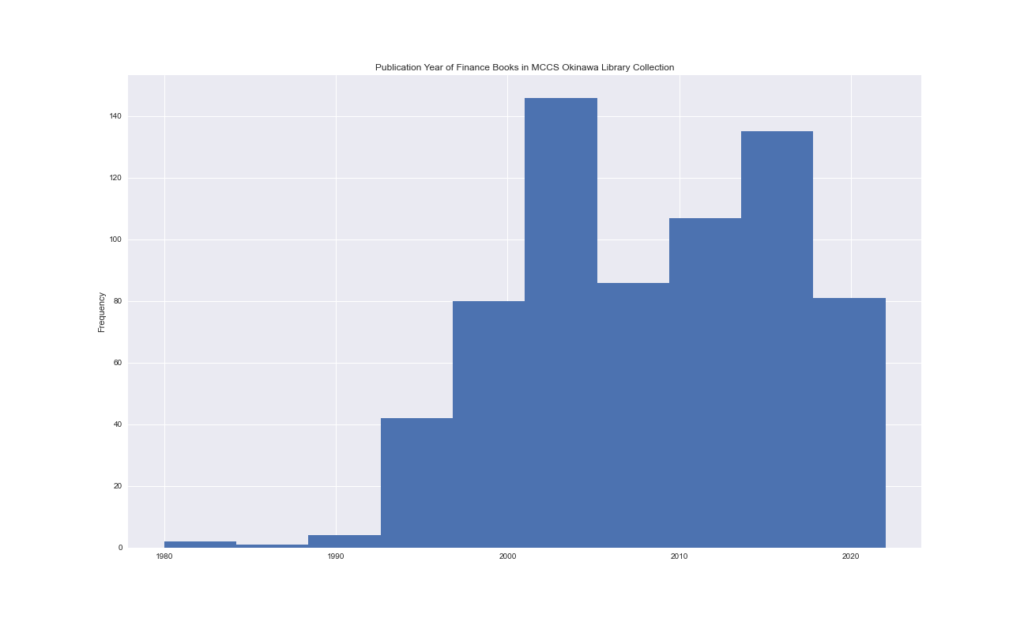
We can also look at features of the items in a neighborhood. Here is the publication date of the items in our Finance section. This histogram helped us identify the need to get some more updated titles.
One way we use this is to figure out our collection needs. For instance, I know we need to weed from one of our libraries and I used pandas to calculate the lowest performing items in each area. At the same time, it gives us an idea of what plays well in that community. A standard ILS report goes in, and I can generate all kind of weeding lists and conclusions.
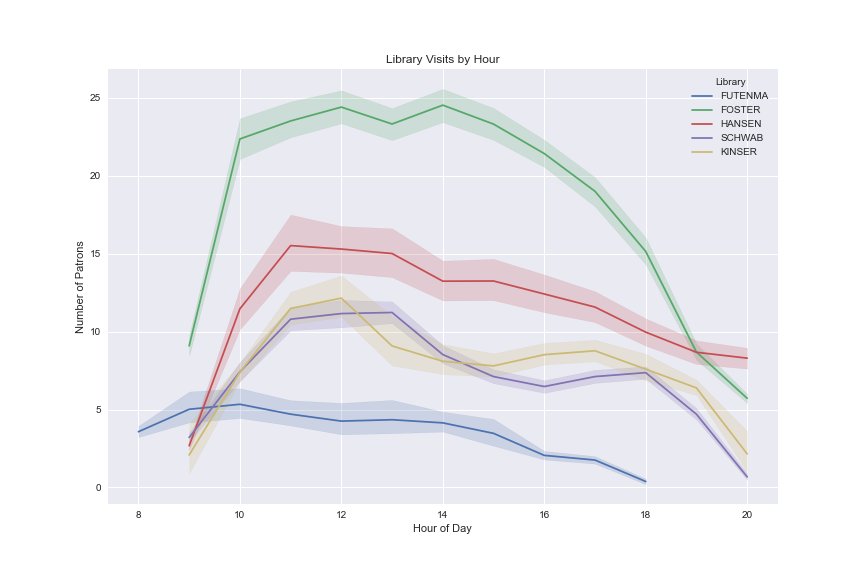
The chart below shows the average number of patrons entering our libraries against the time that they enter. The faded area around the lines show how much variation there is for that time.
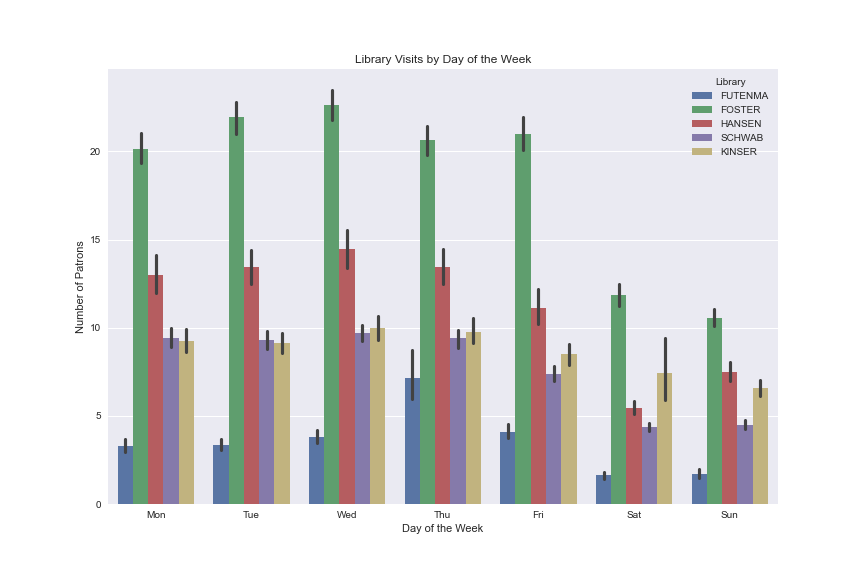
This bar chart shows the same information, but instead of hour of the day, the patron visits are grouped by day of the week, giving a picture of how busy each library is throughout the week.
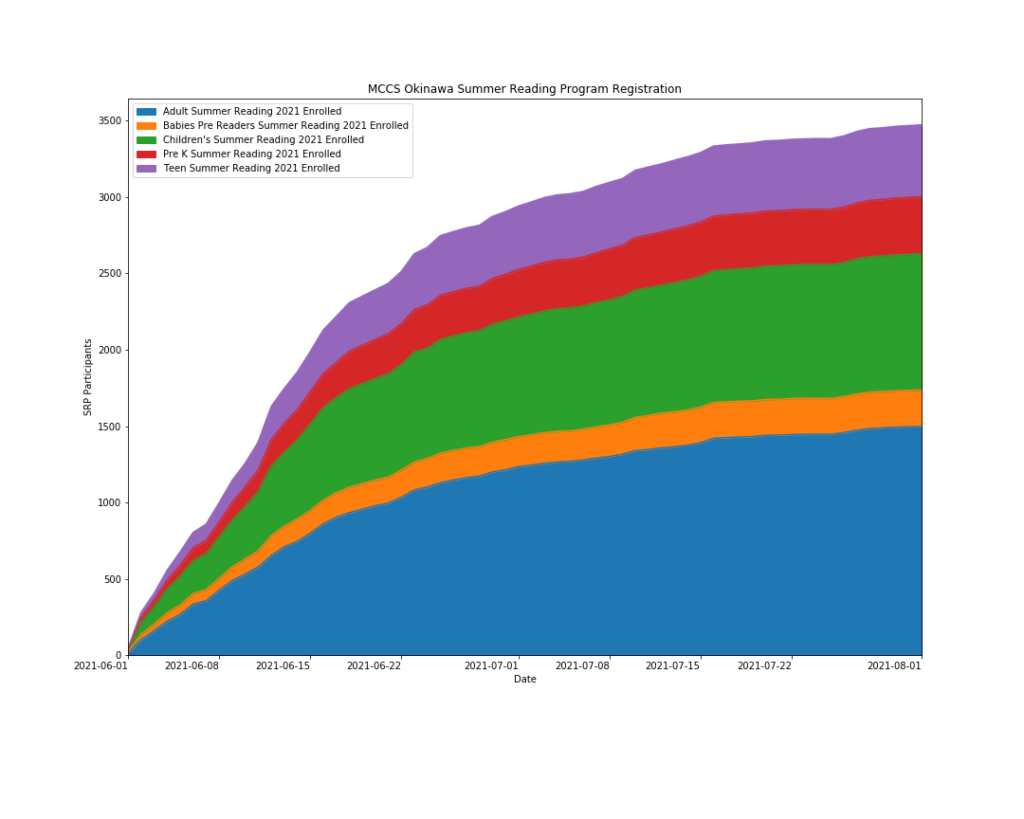
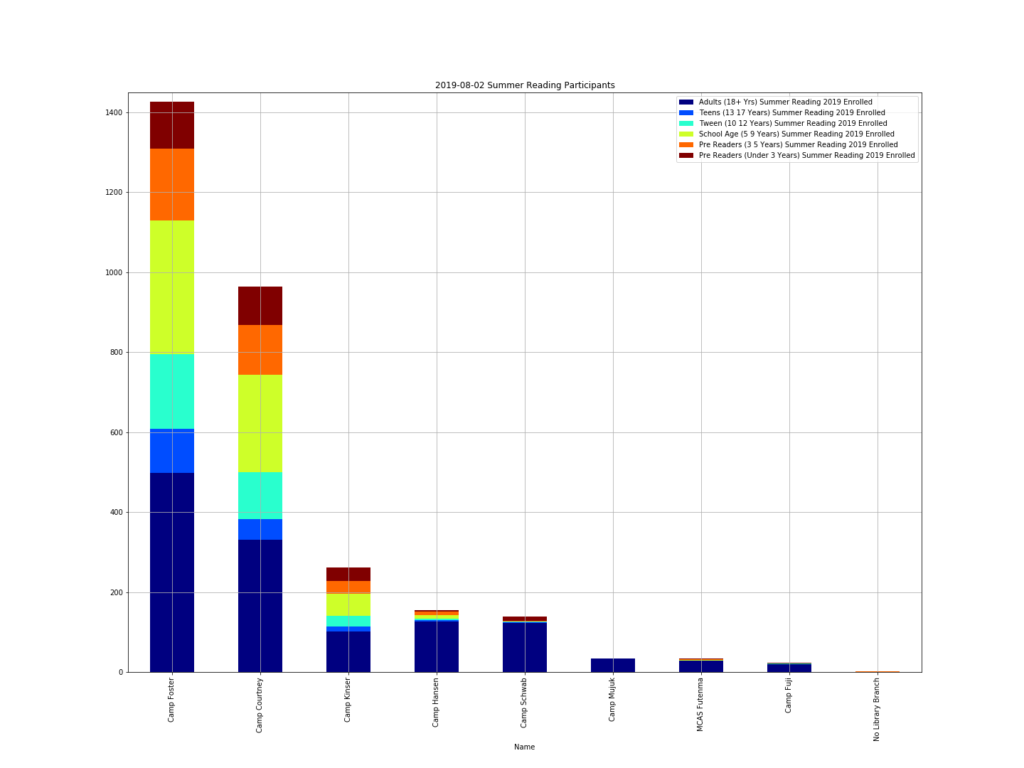
Similarly, I can use reports from our Summer Reading Program to show our customers’ participation. Here you see a stacked bar for each library and the different colors represent the age range (Adult, Teen, Tween, Child, Toddler, Baby).
Th chart below shows registration changes over time for our Summer Reading Program. Each age group is a different color.